Data Analyst Resume Examples & Free Template (PDF, Word)

This data analyst resume template comes pre-filled with a senior analyst’s SQL work, dashboards and A/B test readouts. Change anything you like, download it in either PDF or Word, and use my 3 analyst resume samples and 6-step guide to write your own.

4.9 5.0
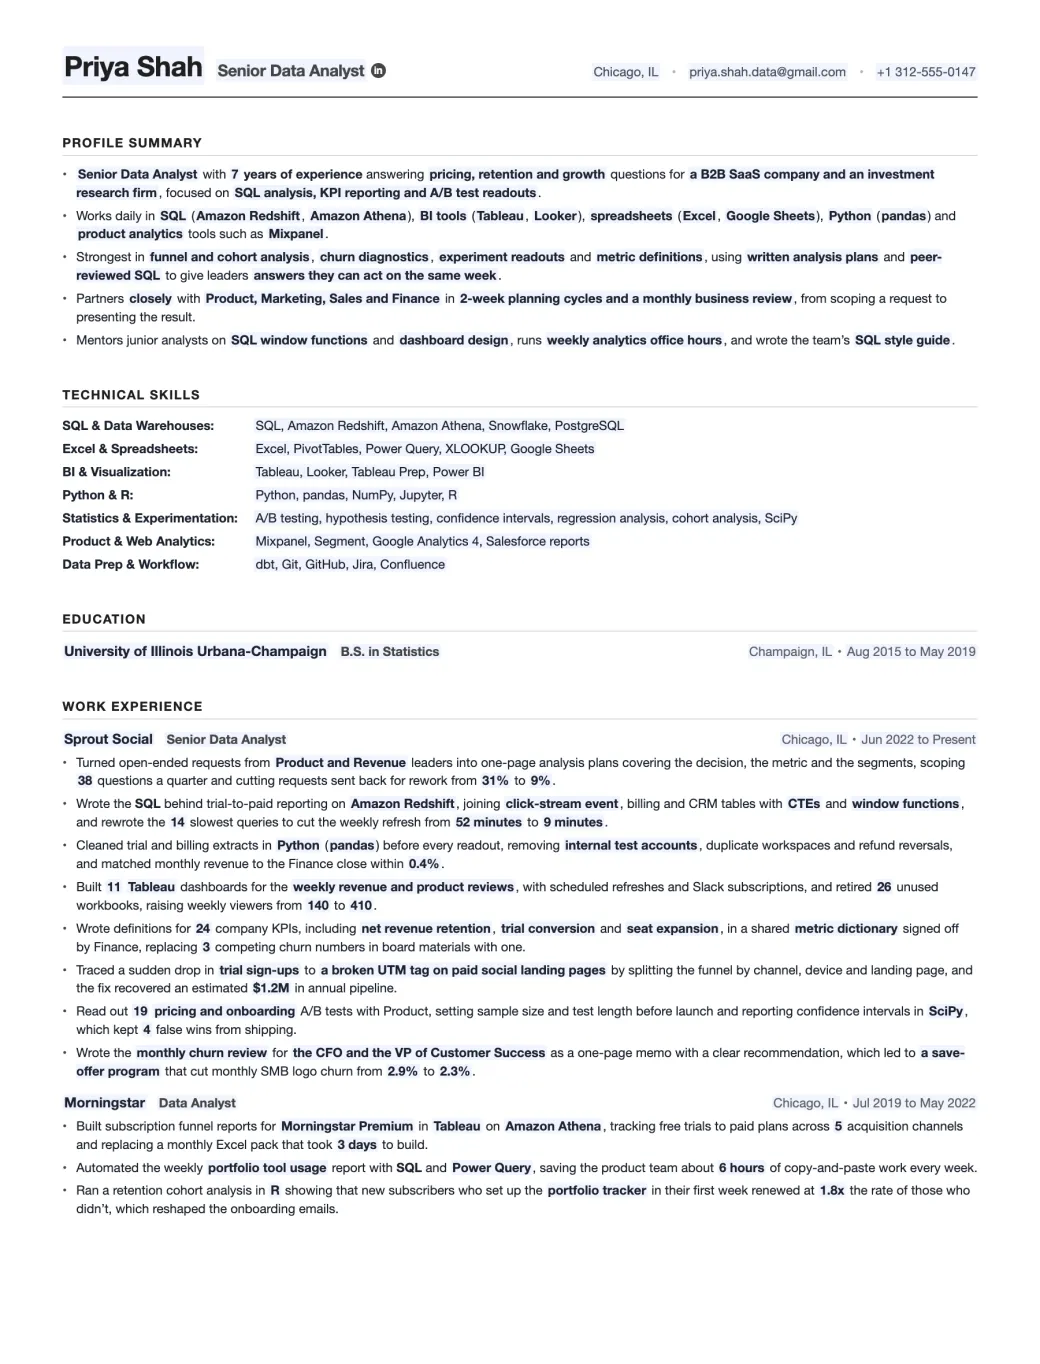
Data Analyst resume template filled in for a senior data analyst at Sprout Social, with a 5-bullet profile summary, 7 skills rows and 11 work experience bullets
Emmanuel Gendre Ex-Google recruiter / Tech resume writer Updated Free, ATS-friendly, no signup

Interactive resume template generator

Interactive Data Analyst Resume Template

Fill in the side panel, then download your resume as a PDF or a Word file.

Edits update live as you type. Toggle Edit to rewrite paper text directly.

Edit mode is on. Click anywhere on the resume to rewrite text. Side-panel placeholders still update live.

Priya Shah Senior Data Analyst

Chicago, IL • priya.shah.data@gmail.com • +1 312-555-0147

Profile Summary

  • Senior Data Analyst with 7 years of experience answering pricing, retention and growth questions for a B2B SaaS company and an investment research firm, focused on SQL analysis, KPI reporting and A/B test readouts.
  • Works daily in SQL (Amazon Redshift, Amazon Athena), BI tools (Tableau, Looker), spreadsheets (Excel, Google Sheets), Python (pandas) and product analytics tools such as Mixpanel.
  • Strongest in funnel and cohort analysis, churn diagnostics, experiment readouts and metric definitions, using written analysis plans and peer-reviewed SQL to give leaders answers they can act on the same week.
  • Partners closely with Product, Marketing, Sales and Finance in 2-week planning cycles and a monthly business review, from scoping a request to presenting the result.
  • Mentors junior analysts on SQL window functions and dashboard design, runs weekly analytics office hours, and wrote the team’s SQL style guide.

Technical Skills

SQL & Data Warehouses:
SQL, Amazon Redshift, Amazon Athena, Snowflake, PostgreSQL
Excel & Spreadsheets:
Excel, PivotTables, Power Query, XLOOKUP, Google Sheets
BI & Visualization:
Tableau, Looker, Tableau Prep, Power BI
Python & R:
Python, pandas, NumPy, Jupyter, R
Statistics & Experimentation:
A/B testing, hypothesis testing, confidence intervals, regression analysis, cohort analysis, SciPy
Product & Web Analytics:
Mixpanel, Segment, Google Analytics 4, Salesforce reports
Data Prep & Workflow:
dbt, Git, GitHub, Jira, Confluence

Education

University of Illinois Urbana-Champaign B.S. in Statistics
Champaign, IL • Aug 2015 to May 2019

Work Experience

Sprout Social Senior Data Analyst
Chicago, IL • Jun 2022 to Present
  • Turned open-ended requests from Product and Revenue leaders into one-page analysis plans covering the decision, the metric and the segments, scoping 38 questions a quarter and cutting requests sent back for rework from 31% to 9%.
  • Wrote the SQL behind trial-to-paid reporting on Amazon Redshift, joining click-stream event, billing and CRM tables with CTEs and window functions, and rewrote the 14 slowest queries to cut the weekly refresh from 52 minutes to 9 minutes.
  • Cleaned trial and billing extracts in Python (pandas) before every readout, removing internal test accounts, duplicate workspaces and refund reversals, and matched monthly revenue to the Finance close within 0.4%.
  • Built 11 Tableau dashboards for the weekly revenue and product reviews, with scheduled refreshes and Slack subscriptions, and retired 26 unused workbooks, raising weekly viewers from 140 to 410.
  • Wrote definitions for 24 company KPIs, including net revenue retention, trial conversion and seat expansion, in a shared metric dictionary signed off by Finance, replacing 3 competing churn numbers in board materials with one.
  • Traced a sudden drop in trial sign-ups to a broken UTM tag on paid social landing pages by splitting the funnel by channel, device and landing page, and the fix recovered an estimated $1.2M in annual pipeline.
  • Read out 19 pricing and onboarding A/B tests with Product, setting sample size and test length before launch and reporting confidence intervals in SciPy, which kept 4 false wins from shipping.
  • Wrote the monthly churn review for the CFO and the VP of Customer Success as a one-page memo with a clear recommendation, which led to a save-offer program that cut monthly SMB logo churn from 2.9% to 2.3%.
Morningstar Data Analyst
Chicago, IL • Jul 2019 to May 2022
  • Built subscription funnel reports for Morningstar Premium in Tableau on Amazon Athena, tracking free trials to paid plans across 5 acquisition channels and replacing a monthly Excel pack that took 3 days to build.
  • Automated the weekly portfolio tool usage report with SQL and Power Query, saving the product team about 6 hours of copy-and-paste work every week.
  • Ran a retention cohort analysis in R showing that new subscribers who set up the portfolio tracker in their first week renewed at 1.8x the rate of those who didn’t, which reshaped the onboarding emails.

Done editing? Download a real PDF (selectable text, ATS-friendly, US Letter) or an editable Word file if a recruiter asks for one.

About this template

A Data Analyst resume template, built by a tech recruiter.

Data analysts are the people a team calls when it needs a straight answer from its numbers. Why did sign-ups fall last week? Did the new pricing page work? You pull the rows with SQL, clean them in Excel or Python, run the numbers, then show the result in Tableau, Power BI or Looker. And the job isn’t done until someone makes a decision with it.

Here’s the problem I see on most analyst resumes. They open with the same 4 tools in the same order: SQL, Excel, Tableau and Python. Every applicant has them, so they don’t set you apart. What does is evidence that people used your work. Think of the decision your analysis changed, the dashboard a team opens every Monday, the test you called correctly or the money a root-cause analysis saved.

I set up this template so each of those has a home. Under the Sprout Social job, you’ll find 8 bullets, each covering one area of the analyst role profile, starting with how the question got framed and ending with the recommendation. Further down are 3 complete resumes: a junior who came from finance, a senior in e-commerce and a lead who runs a team. 6 steps to write a Data Analyst resume come right after the samples, if you’d rather build your own from nothing.

Already have a draft? Send me your resume for review with the upload box below, and I’ll read every line of it.

Industry signal

What the market says about Data Analyst roles

US government job data has no separate line for data analysts. The nearest series is the BLS projection for data scientists, with roughly 24,800 job openings projected each year through 2035. The bigger change is in the tools your stakeholders use. Databricks Genie became generally available in June 2025, Looker’s Conversational Analytics in November 2025 and Agent Mode in Excel in January 2026. Managers can now ask data questions in plain English, so you’ll be hired for knowing whether the answer is right.

24,800 Yearly US openings, data scientist occupation US Bureau of Labor Statistics
$87,134 Average base pay, US data analyst job ads Indeed

Resume Samples

Data Analyst Resume Examples

Your resume at 2 years in analytics and at 11 years shouldn’t read the same. These 3 data analyst resume examples make the difference easy to see. The junior moved from finance into store reporting at Warby Parker. The senior works on checkout and delivery questions at Wayfair. The lead manages 5 analysts on customer experience at Comcast. I wrote each one with the SQL, tools and numbers I check first when I screen an analyst resume. You can download each one as a PDF or a Word file, free and with no signup.

Junior Data Analyst Resume Example

Nobody expects a junior data analyst to have run a test program. What a hiring manager looks for is SQL you wrote against real tables, data you checked before you trusted it, and a report people open every week. Coming from finance or operations, like Jamal? Keep that job on the page: variance analysis and month-end reconciliations are analyst work too.

Years of experience
2 years
Industry
Eyewear retail
Stack
BigQueryLookerGoogle SheetsPython
Download PDF Download Word

Click to download the Junior Data Analyst resume example as a PDF or a Word file. Free / No signup.

Jamal Wright

Junior Data Analyst

New York, NY · jamalwright.data@gmail.com · +1 917-555-0162 · linkedin.com/in/jamalwright

Profile Summary

  • Junior Data Analyst with 2 years at Warby Parker, reporting on store traffic, eye exam bookings and Home Try-On conversion, after 3.5 years as a financial analyst at Bank of America.
  • Writes SQL in BigQuery, builds Looker dashboards, models in Excel and Google Sheets, cleans data in Python (pandas), and reads site funnels in Google Analytics 4.
  • Good at reconciling numbers across systems, store-level variance analysis and short weekly write-ups, habits from the finance month-end close, and checks every query against a known total before sharing it.
  • Works with Retail Operations, the eye exam scheduling team and Ecommerce, sits in the weekly store performance review, and takes ad hoc requests from regional directors through the analytics intake form.
  • Finished the Google Data Analytics Professional Certificate in 2024, is learning A/B test analysis from the senior analysts, and keeps the team’s Looker field descriptions up to date.

Technical Skills

SQL & Data Warehouses:
SQL, BigQuery, joins, CTEs, window functions (learning)
Excel & Spreadsheets:
Excel, PivotTables, XLOOKUP, Power Query, Google Sheets
BI & Visualization:
Looker, Looker Studio, Tableau (coursework)
Python & R:
Python, pandas, Jupyter, R (coursework)
Statistics & Experimentation:
Descriptive statistics, variance analysis, t-tests, reading A/B test results
Product & Web Analytics:
Google Analytics 4, Google Tag Manager (basics)
Data Prep & Workflow:
Git, GitHub, Jira, Confluence
Page 2 of 2

Work Experience

Warby Parker Data Analyst New York, NY · Jun 2024 to Present
  • Scoped a regional director’s question about slow stores into an analysis plan covering traffic, exam bookings and conversion, which put the gap at $640K in yearly sales across 9 Northeast stores.
  • Wrote BigQuery SQL joining point-of-sale, appointment and Home Try-On tables for the weekly store report, with retail calendar date logic, cutting manual pulls from 5 hours to 40 minutes a week.
  • Cleaned appointment data in Python (pandas), removing duplicate bookings and test stores, and matched exam counts to the scheduling system within 1% before each monthly review.
  • Built a Looker store scorecard with traffic, exam bookings, conversion and average order value that 120+ store and regional leaders open every week.
  • Documented 15 retail KPIs, including exam show rate and eyewear attach rate, in Looker field descriptions, so every store leader reads the same definition behind each tile.
Bank of America Financial Analyst New York, NY · Jul 2020 to Feb 2024
  • Traced a $2.1M unfavorable expense variance in a consumer banking cost center to a vendor invoice booked twice, and wrote the correction memo for the controller.
  • Tested whether a new branch referral script worked with a two-sample t-test in Excel, showing that its 4% lift sat inside normal week-to-week noise.
  • Wrote the monthly P&L commentary for the consumer banking directors, leading with the biggest variances and one recommended action each, and cut follow-up questions from about 20 a month to 6.

Education

Google (Coursera) Google Data Analytics Professional Certificate Online · Jan 2024 to Apr 2024
Baruch College, CUNY B.B.A. in Finance New York, NY · Aug 2016 to May 2020

Senior Data Analyst Resume Example

At senior level, the hiring manager wants proof that you pick the question, not only answer it. Show the tests you designed and read out, the root causes you found, and the money attached to them. Tools matter less here: BigQuery and Looker on your resume carry less weight than the decision your analysis changed.

Years of experience
8 years
Industry
Online home goods retail
Stack
TableauJupyterGoogle Analytics 4dbt
Download PDF Download Word

Click to download the Senior Data Analyst resume example as a PDF or a Word file. Free / No signup.

Cintia Mendes

Senior Data Analyst

Boston, MA · cintiamendes.analytics@gmail.com · +1 617-555-0139 · linkedin.com/in/cintiamendes

Profile Summary

  • Senior Data Analyst with 8 years in e-commerce analytics at Wayfair and Tripadvisor, focused on checkout, delivery promise and customer journey questions for product and operations leaders.
  • Works in SQL on BigQuery, builds in Looker and Tableau, analyzes in Python (pandas, statsmodels) in Jupyter, and models in Google Sheets and Excel.
  • Strongest in funnel analysis, A/B test design and readouts and root-cause work on sudden metric drops, and starts every analysis from a written plan the product manager signs off.
  • Partners with product managers, engineers and the delivery experience team, presents at the monthly customer journey review, and covers analysis questions during Way Day and holiday peak.
  • Mentors 2 analysts on test design, reviews SQL for a team of 6, and wrote the team’s A/B test readout template.

Technical Skills

SQL & Data Warehouses:
SQL, BigQuery, window functions, partitioned tables, query cost tuning, PostgreSQL
Excel & Spreadsheets:
Google Sheets, Excel, PivotTables, XLOOKUP
BI & Visualization:
Looker, Tableau, Looker Studio
Python & R:
Python, pandas, NumPy, statsmodels, Jupyter, Matplotlib
Statistics & Experimentation:
A/B testing, power analysis, CUPED, confidence intervals, regression analysis, cohort analysis
Product & Web Analytics:
Google Analytics 4, clickstream event data, funnel and path analysis
Data Prep & Workflow:
dbt, Git, GitHub, Jira, Confluence
Page 2 of 2

Work Experience

Wayfair Senior Analyst, Customer Journey Optimization Boston, MA · May 2022 to Present
  • Turned a product manager’s request for “a delivery dashboard” into a sharper question, whether longer delivery estimates lose big furniture orders, and found that orders over $1,000 converted 18% less past 2 weeks.
  • Rewrote BigQuery SQL over the clickstream event tables with partition filters and approximate distinct counts, cutting the team’s monthly query spend by 37% with no change to any report.
  • Designed and read out 21 checkout A/B tests in Python with power analysis and CUPED variance reduction, shortening the average test from 4 weeks to 16 days.
  • Found the cause of a 9% overnight drop in mobile web add-to-cart, a tracking release that fired page views twice, by comparing event counts by app version and page type.
  • Presented the quarterly customer journey review to the VP of Product with 3 recommendations, and the returns-policy test that came out of it added an estimated $11M a year.
Tripadvisor Data Analyst Needham, MA · Jul 2018 to Apr 2022
  • Built Python validation checks for hotel booking data from 40+ partner feeds, catching duplicate and test bookings early and cutting revenue report restatements to 1 in 2021.
  • Moved 30 recurring Mode reports into Tableau dashboards for the Hotels product team, with scheduled refreshes that freed about a day a week for 4 analysts.
  • Defined revenue per visitor for hotel pages with Finance and set weekly targets by market, and it replaced click-through as the main goal metric for 6 product teams.

Education

Boston University B.A. in Mathematics, Statistics specialty Boston, MA · Sep 2014 to May 2018

Lead Data Analyst Resume Example

A lead data analyst gets judged on what the team delivers as much as on their own queries. Put the team size, the way you take in and rank requests, and the business reviews you run near the top, then back them with results leaders acted on. Keep some hands-on SQL in there: most lead roles still write it every week.

Years of experience
11 years
Industry
Telecom and media
Stack
SnowflakeDatabricksPower BIAlteryx
Download PDF Download Word

Click to download the Lead Data Analyst resume example as a PDF or a Word file. Free / No signup.

Andrei Popov

Lead Data Analyst

Philadelphia, PA · andreipopov.data@gmail.com · +1 215-555-0178 · linkedin.com/in/andreipopov

Profile Summary

  • Lead Data Analyst with 11 years in customer and contact center analytics at Comcast and Vanguard, leading 5 analysts who answer care, digital and retention questions for Xfinity leaders.
  • Works in SQL on Snowflake and Databricks SQL, publishes in Tableau and Power BI, prepares data in Alteryx and dbt, and uses Python for forecasts and statistical tests.
  • Known for contact driver analysis, call volume forecasting, test-and-control readouts for care programs, and a KPI catalog that care, digital and finance teams all report from.
  • Partners with care operations, digital product and finance directors, runs the monthly customer experience business review, and works with data engineering on the tables the team depends on.
  • Hired and coaches 5 analysts, runs the team’s request intake and ranking, and set up peer review for every query that ends up in an executive deck.

Technical Skills

SQL & Data Warehouses:
SQL, Snowflake, Databricks SQL, Teradata, query tuning
Excel & Spreadsheets:
Excel, Power Query, PivotTables, VBA
BI & Visualization:
Tableau, Power BI, Tableau Prep
Python & R:
Python, pandas, Prophet, Jupyter, R
Statistics & Experimentation:
Test-and-control design, difference-in-differences, regression analysis, time series forecasting
Product & Web Analytics:
Adobe Analytics, digital self-service funnels, IVR and chat journey data
Data Prep & Workflow:
Alteryx, dbt, Git, Jira, Confluence
Page 2 of 2

Work Experience

Comcast Lead, Customer Experience Analytics Philadelphia, PA · Mar 2021 to Present
  • Set up a request intake for care and digital leaders that asks for the decision behind every question, which cut the team’s backlog of open requests from 70 to 25.
  • Traced the top drivers of repeat billing calls across IVR, chat and agent notes, and the 3 fixes the team sized for the care VP cut repeat billing calls by 12%.
  • Built the customer experience KPI catalog in Confluence with care, digital and finance, defining 32 metrics such as first contact resolution and digital containment rate.
  • Designed test-and-control readouts in Python for 14 care programs, using difference-in-differences where random assignment wasn’t possible, and the results ended 3 programs with no effect.
  • Runs the monthly customer experience business review for the SVP of Customer Care, turning Tableau and Power BI views into a short story with one ask per slide, and leaders have approved $6.5M in care investments from it.
Vanguard Senior Data Analyst Malvern, PA · Jul 2015 to Feb 2021
  • Rewrote the Teradata SQL behind the client service call reports with volatile tables and a better join order, cutting the nightly run from 3 hours to 35 minutes.
  • Built Alteryx workflows that cleaned and matched call, web and account data for client service, replacing 11 manual Excel steps and the errors that came with them.
  • Built Tableau dashboards for call volume, wait time and service level across 4 sites, and the daily staffing call run from them cut average speed to answer from 95 to 48 seconds.

Education

Pennsylvania State University B.S. in Statistics University Park, PA · Aug 2011 to May 2015

Free resume review

A recruiter screen, but with feedback

You applied to hundreds of jobs: no result. Companies won’t give you feedback, so you’re stuck in a loop. Rejections will keep coming until you know what’s wrong.

Let’s break this cycle today!

I’ll screen your resume the same way I did at Google.

You’ll get:

  • Your resume sections and content scored.
  • A clear list of what to improve, why, and how.
  • Behind the scenes secrets on the screening process.

How I rewrite Data Analyst resumes

How to write a Data Analyst resume

Emmanuel Gendre, ex-Google recruiter

Emmanuel Gendre Ex-Google recruiter, tech resume writer

Most of what I know about analyst resumes, I learned reading them as a recruiter, for 13 years and at Google for many of them. Now I rewrite them for a living, and the same weak spot shows up on most of the ones I get. It’s a list of tasks like “built dashboards” and “wrote SQL queries”, with nothing about who used the work or what changed because of it.

When an analyst signs up for my tech resume writing services, I rewrite each bullet so it says what was asked, how they answered it and what the business did next. If you’re doing it yourself, though, focus on these 6 steps. I’ve put analyst examples in every one.

  1. Step 1 Format & layout Plain headings, one column, no skill-bar charts, and a PDF by default. Go to step 1
  2. Step 2 Profile Summary Your level, your SQL and BI tools, and your best work, in 5 bullets. Go to step 2
  3. Step 3 Work Experience Cover your current job from first question to final recommendation. Go to step 3
  4. Step 4 Bullet Points Turn “built a dashboard” into something worth an interview. Go to step 4
  5. Step 5 Technical Skills 7 skill rows from SQL to product analytics, plus 5 soft skills. Go to step 5
  6. Step 6 Keywords & Metrics The words recruiters search for, plus 24 analyst metrics for your bullets. Go to step 6

Step 1 · Format & Layout

Data Analyst resume format and layout

First up is the format, since it’s the part that takes the least time to get right. Software opens your file first, then a recruiter looks for 3 things in it: job titles, employers and dates. If either of them can’t find those quickly, nothing else on the page gets a chance.

01ATS Compliance

ATS compliance for your Data Analyst resume

Whether it’s a startup on Greenhouse or a bank on Workday, an Applicant Tracking System (ATS) holds your application before any person sees it. The ATS turns your file into a searchable candidate record, and when a recruiter filters by “Tableau” or “SQL”, only cleanly parsed resumes appear. Side columns and text boxes cause most parsing errors. If you’re curious about the mechanics, read my guide to how ATS parsing works. For your analyst resume, keeping it machine-readable comes down to 3 rules:

The 3 rules
  1. Use a 100% text based format (no Canva!)

  2. Avoid tables, pictures, and complex structures.

  3. Use the most predictable section names, like “Profile Summary” and “Work Experience”

02Design & Layout

Data Analyst resume design and layout

Analysts love a good chart, so I see a lot of resumes with skill bars, a pie chart of “time spent in SQL” or a layout that looks like a dashboard. On a resume, they backfire. Recruiters hate fancy designs. When yours is the 40th resume of their morning, they want to spot your title, employer and dates in a second, and a chart rating your own Python at 4 out of 5 tells them nothing.

My advice is to make yours plain and predictable, with one column, a single typeface and the section headings recruiters already know. Want to show your chart skills? Add a link to 2 or 3 dashboards on Tableau Public that you’d be glad to explain in an interview. Writing the resume from scratch? These are the specs I use, and the template above sticks to them.

Layout Spec
Columns
One. No sidebars, tables, columns, pictures or tabs.
Margins
0.7 in on all four sides
Body size
10 to 11 pt
Type
One family, weight for hierarchy
Length
One page under 5 years, two after
Section order
Summary, Skills, Experience, Education
PDF

03File Format

Resume file format for your Data Analyst resume

For an analyst resume, start with PDF. It keeps your layout fixed whoever opens it, and ATS software handles it well. Just don’t photograph or scan a printout: to an ATS, that’s a picture with no words in it. Keep a Word version ready for staffing agencies that place contract analysts, because many of them reformat resumes onto their own letterhead. There’s more detail in my piece on PDF versus Word resumes.

Format Guide
PDF
Your default. Layout holds, text stays selectable.
Word (.docx)
When the posting or a recruiter asks for it. Use the Word download above.
Plain text
For portals that make you paste into a box
Never
Images, scans, password-protected PDFs, shared-drive links
File name
Priya-Shah-Data-Analyst.pdf

Step 2 · Profile Summary

Data Analyst profile summary

Bootcamp grads with a single project need a profile summary too, same as senior analysts. Here’s why. Recruiters do a fast first skim to decide whether you’re worth a closer look, and in that skim the top few lines carry most of the weight. Both stages are covered in my breakdown of recruiter resume screening.

An analyst summary should tell a hiring manager 3 things in a few seconds. What business questions do you usually answer? Which warehouse and BI tool are you in every day? And do product, finance or marketing people rely on your numbers? The 5 bullets below split that job between them, and there are plenty more samples in my guide on writing profile summaries.

  1. 1

    Title, years and scope

    Lead with whatever title the posting uses (Data Analyst, Senior Data Analyst, Product Analyst), then your years, your industry and the kind of questions you answer, such as pricing, retention or operations. It’s the line recruiters use to judge your seniority.

  2. 2

    Your stack

    List your tools in the buckets analyst ads use: SQL and a warehouse, BI tools, spreadsheets, Python or R, and product analytics. Match the ad’s product names, like Amazon Redshift or Power BI, since that’s what the ATS compares.

  3. 3

    Domain expertise

    The analysis you’re best at (funnels, cohorts, churn, test readouts) and how you work, such as written analysis plans or peer-reviewed SQL. Here a hiring manager sees which questions they could hand you in your first week.

  4. 4

    Collaboration

    The teams you answer questions for, such as product, marketing, sales or finance, and the meetings you show up in: weekly business reviews, planning cycles, launch readouts. An analyst who works alone won’t change much, and recruiters know it.

  5. 5

    Leadership

    The juniors you coach, the office hours or SQL reviews you run, the guide or metric dictionary you wrote. Plenty of senior analysts manage nobody and still fill this bullet. Hiring managers take it as proof you’ll make the whole team better.

Data Analyst resume summary example, from the template above
  • Senior Data Analyst with 7 years of experience answering pricing, retention and growth questions for a B2B SaaS company and an investment research firm, focused on SQL analysis, KPI reporting and A/B test readouts.
  • Works daily in SQL (Amazon Redshift, Amazon Athena), BI tools (Tableau, Looker), spreadsheets (Excel, Google Sheets), Python (pandas) and product analytics tools such as Mixpanel.
  • Strongest in funnel and cohort analysis, churn diagnostics, experiment readouts and metric definitions, using written analysis plans and peer-reviewed SQL to give leaders answers they can act on the same week.
  • Partners closely with Product, Marketing, Sales and Finance in 2-week planning cycles and a monthly business review, from scoping a request to presenting the result.
  • Mentors junior analysts on SQL window functions and dashboard design, runs weekly analytics office hours, and wrote the team’s SQL style guide.

Step 3 · Work Experience

Data Analyst work experience

Once the summary has made its case, the recruiter moves on to the job at the top of your Work Experience. From my years of screening, I’d put 95% of the decision on that one role. It’s the clearest picture of the data you query, the tools you open and the teams you report to today, and that’s what they’re hiring for.

That’s why I give the current job 8 bullets, one for every competency in the Data Analyst role profile. A role profile is what recruiters screen you against: the core competencies of the job, which for analysts run from framing the question to presenting the answer. Leave one out and they’ll notice. With no A/B test bullet, a hiring manager will guess the readouts were someone else’s job.

Data Analyst role profile
  1. Business Question Framing

    You turn a vague request into a question the data can answer. A lot of analysis that goes nowhere starts with the wrong question, and managers want analysts who’ll push back before they open the warehouse. Tell them how you used written analysis plans and stakeholder kickoffs to agree on the decision and the metric up front.

    Techniques
    analysis plans, stakeholder kickoffs, hypothesis framing, scoping
    Tools
    Confluence, Notion, Jira, Google Docs
    Metrics
    requests scoped, rework rate, decisions informed
  2. SQL Querying & Data Extraction

    You pull the right rows from tables other teams built. A wrong join gives you confident numbers that are simply false, and one of those in a VP’s deck can cost you their trust for good. Show them how you used CTEs, window functions and careful join logic in Snowflake, BigQuery or Redshift to write queries that are both correct and fast.

    Techniques
    joins, CTEs, window functions, query tuning
    Tools
    Snowflake, BigQuery, Amazon Redshift, PostgreSQL
    Metrics
    query run time, refresh time, queries rewritten
  3. Data Cleaning & Validation

    You make sure the data holds up before anyone builds a decision on it. Test accounts, duplicate orders and late records hide in every extract, and one bad total in a leadership deck can follow you for months. Describe how you used reconciliation against the source system and checks in Excel or pandas to catch problems before you shared a number.

    Techniques
    deduplication, outlier checks, source reconciliation, data profiling
    Tools
    Excel, pandas, dbt tests, Power Query
    Metrics
    match rate to source, errors caught, restatements
  4. Dashboards & Recurring Reports

    You build the reports a team runs its week on. Recruiters see “built 30 dashboards” all the time, so they’ll want to know who opens yours and how often. Walk them through how you used Tableau, Power BI or Looker with scheduled refreshes to replace manual reports, and how many people open them every week now.

    Techniques
    dashboard design, scheduled refreshes, drill-downs, retiring old reports
    Tools
    Tableau, Power BI, Looker, Google Sheets
    Metrics
    weekly viewers, reports automated, hours saved
  5. KPI Definitions & Metric Tracking

    You decide what each number actually means. When finance and marketing each bring their own churn figure, every meeting turns into an argument about the data, and leaders stop trusting all of it. Point out how you used metric dictionaries and sign-off from each business owner to settle on one definition per KPI.

    Techniques
    metric definitions, KPI trees, target setting, owner sign-off
    Tools
    metric dictionary, dbt, Looker, Confluence
    Metrics
    KPIs defined, competing numbers removed, dashboards on the official definitions
  6. Ad Hoc & Root-Cause Analysis

    You work out why a number moved when nobody else can. These questions land on a director’s desk with a deadline attached, and an analyst who answers them fast becomes hard to replace. Explain how you used breakdowns by segment, channel and cohort to find the cause, then put a dollar figure on it.

    Techniques
    funnel breakdowns, cohort analysis, segmentation, anomaly checks
    Tools
    SQL, Python, Excel, Mixpanel
    Metrics
    revenue recovered, cost of the issue, time to answer
  7. A/B Test & Statistical Analysis

    You read tests and comparisons without fooling yourself. A false win can ship a change that costs money for years, and that’s why interviewers dig into this area. Mention how you used sample size planning, confidence intervals and a tool like SciPy or R to call results correctly, including the tests that didn’t work.

    Techniques
    A/B testing, power analysis, confidence intervals, regression
    Tools
    Python (SciPy), R, Excel, Optimizely
    Metrics
    tests read out, false wins stopped, lift measured
  8. Insight Storytelling & Recommendations

    You get leaders to act on the analysis. Most analysis dies in a slide deck, so the analysts who get promoted are the ones whose work turns into decisions. Let them know how you used one-page memos or business review decks to make a clear recommendation, and what happened once it was approved.

    Techniques
    one-page memos, business review decks, chart choice, recommendations
    Tools
    Google Slides, PowerPoint, Tableau, Looker
    Metrics
    recommendations adopted, money approved, results after the change

8 bullets on a single job might feel long. It isn’t a problem for a recruiter when every bullet has a real question and a result behind it. Still waiting on your first analyst title? Take the reporting you do in finance, marketing or operations and fit it into the 8 areas wherever it truthfully belongs.

Submit your resume for a free review!

Step 4 · Bullet Points

Data Analyst resume bullet points

No section takes me longer on a rewrite than the bullets, so I built a step-by-step way of writing them, which I call the Level System. I started from the XYZ formula recruiters at Google use, then added the technical detail analyst bullets need. I’ve written up every rule in my guide to bullet points for tech resumes.

You climb 5 levels, answering one question about the work at each, and every answer goes into the sentence. For analysts, the final answer is normally a dollar amount, a rate, hours saved or how many people rely on the output. Here’s one analyst bullet growing from a bare task to a finished line.

  1. Level 1Task

    What did I work on? Start with the analysis you delivered. On its own, it tells a recruiter what you did but not how well.

    Analyzed why first-time buyers didn’t place a second order.

  2. Level 2+ Techniques

    How did I do it? Add the techniques. This is where the hiring manager sees how you think about data.

    Analyzed why first-time buyers didn’t place a second order with a cohort retention analysis and a delivery-time segmentation.

  3. Level 3+ Tools

    What tools did I use? Write the warehouse and the BI tool by name. Recruiters search the ATS for those exact words.

    Analyzed why first-time buyers didn’t place a second order with a cohort retention analysis and a delivery-time segmentation in Snowflake SQL and Tableau.

  4. Level 4+ Method

    What method did I follow? Say how you made sure the answer was right. Most analysts leave it out, and it’s what makes the result believable.

    Analyzed why first-time buyers didn’t place a second order with a cohort retention analysis and a delivery-time segmentation in Snowflake SQL and Tableau, and tested the fix against a 4-week holdout group.

  5. Level 5+ Metric

    What was the result? Finish on one number a hiring manager could repeat to their boss: revenue, a rate, time saved.

    Analyzed why first-time buyers didn’t place a second order with a cohort retention analysis and a delivery-time segmentation in Snowflake SQL and Tableau, and tested the fix against a 4-week holdout group, lifting the 60-day repeat purchase rate from 18% to 23%.

    1. 01 Task What you worked on
    2. 02 Techniques How you did it
    3. 03 Tools The stack you used
    4. 04 Method The method you followed
    5. 05 Metric The result, one number

Most analysts already hold the numbers for these bullets. Your closed Jira tickets show how many requests you handled, old business review decks show what leadership saw, and launch notes show what changed after your analysis. Dig through those before you write, and you’ll rarely be stuck for a number.

Step 5 · Technical Skills

Data Analyst resume skills

Open any 5 analyst postings and you’ll count 7 recurring skill groups: SQL and a warehouse, Excel, a BI tool, Python or R, statistics, product analytics and workflow tools. Write every product name the way the ad writes it. If it says Power BI and Microsoft Fabric, list both, since the recruiter will type those same words into the ATS.

Leave off any tool you couldn’t demo on the spot. Write pandas, and you may be handed a messy CSV to clean on a shared screen. After this come my 7 analyst skill categories, the skills section Priya’s template ends up with, and 5 soft skills, each with a proof line you can adapt. Keywords get their own step next.

The 7 skill categories for a Data Analyst resume

A star means most analyst postings I’ve read ask for it, so starred skills lead each row. The rest are extras: add one only after using it on real work.

SQL & Data Warehouses

Your query language and the warehouse you run it on. Write the warehouse by name (Snowflake, BigQuery, Redshift), since recruiters search for it.

SQLSnowflakeBigQueryAmazon RedshiftPostgreSQLSQL ServerDatabricks SQL

Excel & Spreadsheets

It’s still on almost every analyst posting. List the features that show depth, like PivotTables and Power Query, not just “Excel”.

ExcelPivotTablesPower QueryXLOOKUPGoogle SheetsVBA

BI & Visualization

The tools your dashboards live in. Put the 1 or 2 you build in every week first, and skip anything you’ve only opened once.

TableauPower BILookerLooker StudioSigma ComputingMetabase

Python & R

For the cleaning, analysis and charts a BI tool can’t handle. Pandas is the library analyst postings ask for most.

PythonpandasNumPyJupyterMatplotlibRRStudio

Statistics & Experimentation

The methods behind your test readouts and comparisons. A/B testing and hypothesis testing come up in most mid-level postings.

A/B testingHypothesis testingConfidence intervalsRegression analysisCohort analysisSample size planningSciPy

Product & Web Analytics

Event and web tracking tools for funnel and user behavior work: GA4 for marketing teams, Amplitude or Mixpanel for product teams.

Google Analytics 4AmplitudeMixpanelAdobe AnalyticsGoogle Tag ManagerSegment

Data Prep & Workflow

How you prepare data and share your work: dbt models, Alteryx workflows, Git for your SQL, and the team’s ticket queue.

dbtGitAlteryxGitHubJiraConfluence

A finished Data Analyst skills section

Technical Skills sample, from the template above
SQL & Data Warehouses
SQL, Amazon Redshift, Amazon Athena, Snowflake, PostgreSQL
Excel & Spreadsheets
Excel, PivotTables, Power Query, XLOOKUP, Google Sheets
BI & Visualization
Tableau, Looker, Tableau Prep, Power BI
Python & R
Python, pandas, NumPy, Jupyter, R
Statistics & Experimentation
A/B testing, hypothesis testing, confidence intervals, regression analysis, cohort analysis, SciPy
Product & Web Analytics
Mixpanel, Segment, Google Analytics 4, Salesforce reports
Data Prep & Workflow
dbt, Git, GitHub, Jira, Confluence

Soft skills for a Data Analyst resume

“Great communication skills” in a skills row proves nothing to a recruiter. A bullet where you explained a test result to a VP does. Below are 5 soft skills I check for on analyst resumes, each with a proof line you can rework for your own.

  • Asking what decision the numbers are for before writing a query

    Resume bulletStarted every new request with a 10-minute chat about the decision behind it, and dropped 1 in 4 requests that no decision depended on.

  • Telling a stakeholder the data can’t answer their question yet

    Resume bulletTold the CMO the attribution data couldn’t compare 3 channels yet, then set up the tracking that answered it 6 weeks later.

  • Explaining a test result to people who never took statistics

    Resume bulletRewrote A/B test readouts as plain-English summaries with one chart each, cutting follow-up questions from product managers by about half.

  • Juggling requests from several teams without dropping one

    Resume bulletRan one shared request queue for 4 teams with a weekly ranking meeting, and hit 95% of agreed delivery dates over 2 quarters.

  • Checking your own numbers before anyone else sees them

    Resume bulletReconciled every board metric with the finance close before sending it, and caught 3 errors that would have gone into the board deck.

Step 6 · Keywords & Metrics

Data Analyst resume keywords and metrics

My final check on an analyst resume covers 2 things. One is keywords, because a recruiter searching the ATS for “SQL” or “Tableau” only finds resumes that contain those words. The other is metrics, a number in every bullet such as revenue found, a conversion lift or hours saved.

Work through the keyword tiers, then paste a real analyst job ad into the finder and see what’s missing from your page. Last comes the metrics table: 24 numbers analysts can use, grouped under the 8 role-profile areas with a sample bullet beside each.

+42%

Data Analyst resume keywords, ranked

Pick any chip to see how postings usually word it. Ads mix their terms: one says “A/B testing”, another “experimentation” or “test and learn”, so learn all three.

Must-have

8

Use each one in your summary, in at least one bullet and in your skills rows.

In a job description“Advanced SQL, including joins, CTEs and window functions”

Strong supporting

9

Add the ones you’ve used for real, ideally in a bullet with a result.

In a job description“Experience with Looker or LookML is a plus”

Bonus

8

Worth a mention when the posting asks for them and you’ve used them.

In a job description“Experience with Python or R for statistical analysis”

Extract Data Analyst keywords from a job description

Got a data analyst, product analyst or business data analyst posting open? Paste it below and the finder pulls out the SQL, BI, spreadsheet and statistics skills in it, sorted into tiers, so you know what to add before you apply.

Must-have
Put these in your skills section and back each one with a bullet.
Strong supporting
Add the ones you’ve actually worked with. Skip the rest.

Nothing is uploaded: it all happens in your browser.

Metrics for a Data Analyst resume

Below, each role-profile area has 3 metrics with a bullet showing how an analyst would use them. You don’t need more than one real number per bullet.

MetricExample bullet
Question framing
Requests scoped Count Stakeholder questions you turned into a written analysis plan.Scoped 38 questions a quarter from Product and Revenue into one-page plans, with the decision and metric agreed first.
Rework rate Percent Share of analyses sent back because the question was wrong or unclear.Cut analyses sent back for rework from 31% to 9% by adding a 15-minute scoping call to every new request.
Decisions informed Count Business decisions that used your analysis, such as a launch, a price or a budget.Supplied the numbers behind 7 pricing and packaging decisions in 2025, each logged with the analysis it used.
SQL & extraction
Query run time Time How long a query or report refresh takes to finish.Rewrote the trial-to-paid query with CTEs and window functions, cutting its run time from 52 minutes to 9 minutes.
Queries rewritten Count Slow or wrong queries you fixed or replaced.Rewrote the 14 slowest queries behind weekly revenue reporting on Amazon Redshift without changing a single output number.
Query cost Money Warehouse spend on your team’s queries.Lowered the analytics team’s monthly BigQuery bill by $6,800 with partition filters and no more SELECT * queries.
Data cleaning
Match rate to source Percent How closely your totals agree with the system of record.Kept monthly revenue in the analytics tables within 0.4% of the Finance close for 18 months running.
Records removed Count Duplicate, test or invalid records you filtered out before analysis.Removed 2,300 internal test accounts from trial data that had been inflating trial conversion in every report.
Restatements Count Reports you had to correct and send again after sharing them.Cut corrected-and-resent reports from 9 a year to 1 by adding row-count and total checks in pandas before each send.
Dashboards & reports
Weekly viewers Count People who open a dashboard in a typical week.Grew weekly viewers of the revenue dashboards from 140 to 410 after rebuilding them around the questions leaders asked most.
Reports automated Count Manual reports replaced by scheduled dashboards or extracts.Replaced 12 manual Excel reports with scheduled Tableau dashboards for Sales and Customer Success.
Hours saved Time Manual reporting time removed per week or month.Saved the product team about 6 hours a week by automating the usage report with SQL and Power Query.
KPI definitions
KPIs defined Count Metrics with a written, signed-off definition.Wrote and got Finance sign-off on 24 KPI definitions, including net revenue retention and trial conversion.
Competing numbers removed Count Versions of the same metric you replaced with one definition.Replaced 3 competing churn numbers in board materials with one definition owned by Finance.
Definition coverage Percent Share of dashboards that use the official definitions.Moved 90% of Tableau dashboards onto the shared metric definitions within 2 quarters.
Root-cause analysis
Revenue recovered Money Revenue or pipeline won back after you found the cause of a drop.Found a broken UTM tag behind a drop in trial sign-ups, and the fix recovered an estimated $1.2M in annual pipeline.
Cost of the issue Money What a problem was costing the business when you found it.Sized an Android checkout bug at $38K a week in lost orders, which got it fixed in the next sprint.
Time to answer Time Time from the question landing to your answer.Cut the average time to answer a “why did this drop?” question from 4 days to 1 with a standard funnel breakdown query.
A/B tests & statistics
Tests read out Count Experiments you analyzed and reported on.Read out 19 pricing and onboarding tests in a year, each with sample size and test length set before launch.
False wins stopped Count Tests that looked positive but didn’t hold up once analyzed properly.Kept 4 false wins from shipping by reporting confidence intervals instead of daily p-values.
Measured lift Percent Change in the main metric between the test and control groups.Measured a 6.2% lift in trial-to-paid conversion from a shorter onboarding checklist over a 3-week test.
Storytelling
Recommendations adopted Count Recommendations that leaders approved and acted on.Got 5 of 7 recommendations from the monthly churn review approved by the CFO in 2025.
Money approved Money Budget approved on the back of your analysis.Made the case for a save-offer program in a one-page memo, and leadership approved $450K for it.
Result after the change Percent What the metric did after the business acted on your recommendation.Recommended a save-offer program that cut monthly SMB logo churn from 2.9% to 2.3% within 2 quarters.

What if you don’t have exact numbers?

  • 1

    Start with the logs your tools keep. Tableau and Looker record dashboard views, and your warehouse keeps every query with its run time.

  • 2

    Round down and keep a note. “About 120 weekly viewers” works. Expect an interviewer to ask which Tableau usage report it came from, and have the answer ready.

  • 3

    No result to measure? Show the scale. The tables you worked across, the teams relying on you or the revenue of the business line you covered all show a recruiter how much was riding on your work.

Free resume review

A recruiter screen, but with feedback

You applied to hundreds of jobs: no result. Companies won’t give you feedback, so you’re stuck in a loop. Rejections will keep coming until you know what’s wrong.

Let’s break this cycle today!

I’ll screen your resume the same way I did at Google.

You’ll get:

  • Your resume sections and content scored.
  • A clear list of what to improve, why, and how.
  • Behind the scenes secrets on the screening process.

Frequently asked

Data Analyst resume FAQ

It is, with no catch. You won’t be asked for an email, a card or an account. Use it as often as you want, for as many versions of your resume as you need.

Yes. Next to Download PDF you’ll see a Word button, which saves an editable .docx. The 3 analyst samples come in Word as well. Apply with the PDF, though, and keep the .docx for the odd agency that wants to tweak the formatting before sending you to a client.

Yes. One column, standard headings and selectable text mean Workday, Greenhouse or Lever can parse it without errors. Want to test it with your own resume? Upload your file to my ATS resume checker tool and see exactly which fields it pulls out.

Under 5 years in analytics, stick to 1 page. With more experience, a second page is fine. What gets analyst resumes rejected isn’t length, it’s bullets with no numbers in them, so never cut a result just to save space.

Early on, the Google Data Analytics Professional Certificate shows up on more junior resumes I read than any other, and it helps when you don’t have an analyst job yet. Tool certifications such as Microsoft’s PL-300 for Power BI or Tableau Certified Data Analyst help when the posting uses that tool. Once your results span a few years, they carry far more weight than any certificate.

Anything that shows your analysis got used: revenue found or protected, a change in conversion or retention, hours of manual reporting cut, dashboard viewers, tests read out. Stick to one per bullet. You’ll find 24 analyst metrics with example bullets in the metrics table in Step 6.

Think about what you deliver. A data analyst hands over answers: a query, a spreadsheet model, a test readout, a recommendation. The BI developer resume template is built around data models and reports that other people query, and the data scientist resume template around predictive models and experiments. Building the pipelines that feed all of this? Then you want the resume template for data engineers.

Treat a strong project like a job. Pick a public dataset close to the industry you want, write the SQL, clean the data, build a dashboard, and write down your answer and what you’d recommend. List it at the top of Work Experience with the same bullet structure. Analysis from a finance, operations or marketing job counts too, so map it onto the 8 areas.

No. A recruiter judges what you wrote, and nobody cares that the layout came from a free template. The risk is sending it with Priya’s bullets still in it, or with numbers you can’t explain. Swap in your own questions, tools and results line by line.

More resources

More help with your Data Analyst resume